Picture the scene: A tropical storm has wended its way along the Gulf Coast of the United States, one of the more refinery-rich stretches of land in the developed world. Or imagine rumours are circulating of a build-up of troops in the Persian Gulf. Or perhaps an OPEC member has just announced a production cut but has not given details.
Any of these developments has the potential to roil energy markets, and for a simple reason. They’re all extremely supply-sensitive pieces of information. But this kind of news brings a lot of uncertainty with it. How much supply are we actually talking about? What was the situation beforehand?
Energy traders have long relied on any snippet of exclusive information to gain an edge. Sometimes that means literally sending out people to count the number of tanker arrivals in certain cities. If a firm has come up with a method of prising market-sensitive information out of observable events, it’s easily worth devoting the resources to capture the data, even if it means staking out ports. Markets in physical goods, unlike financial products, will always have a close link to the “real world”.
But counting ships, or other forms of human fact-finding, can be slow, incomplete and inaccurate.
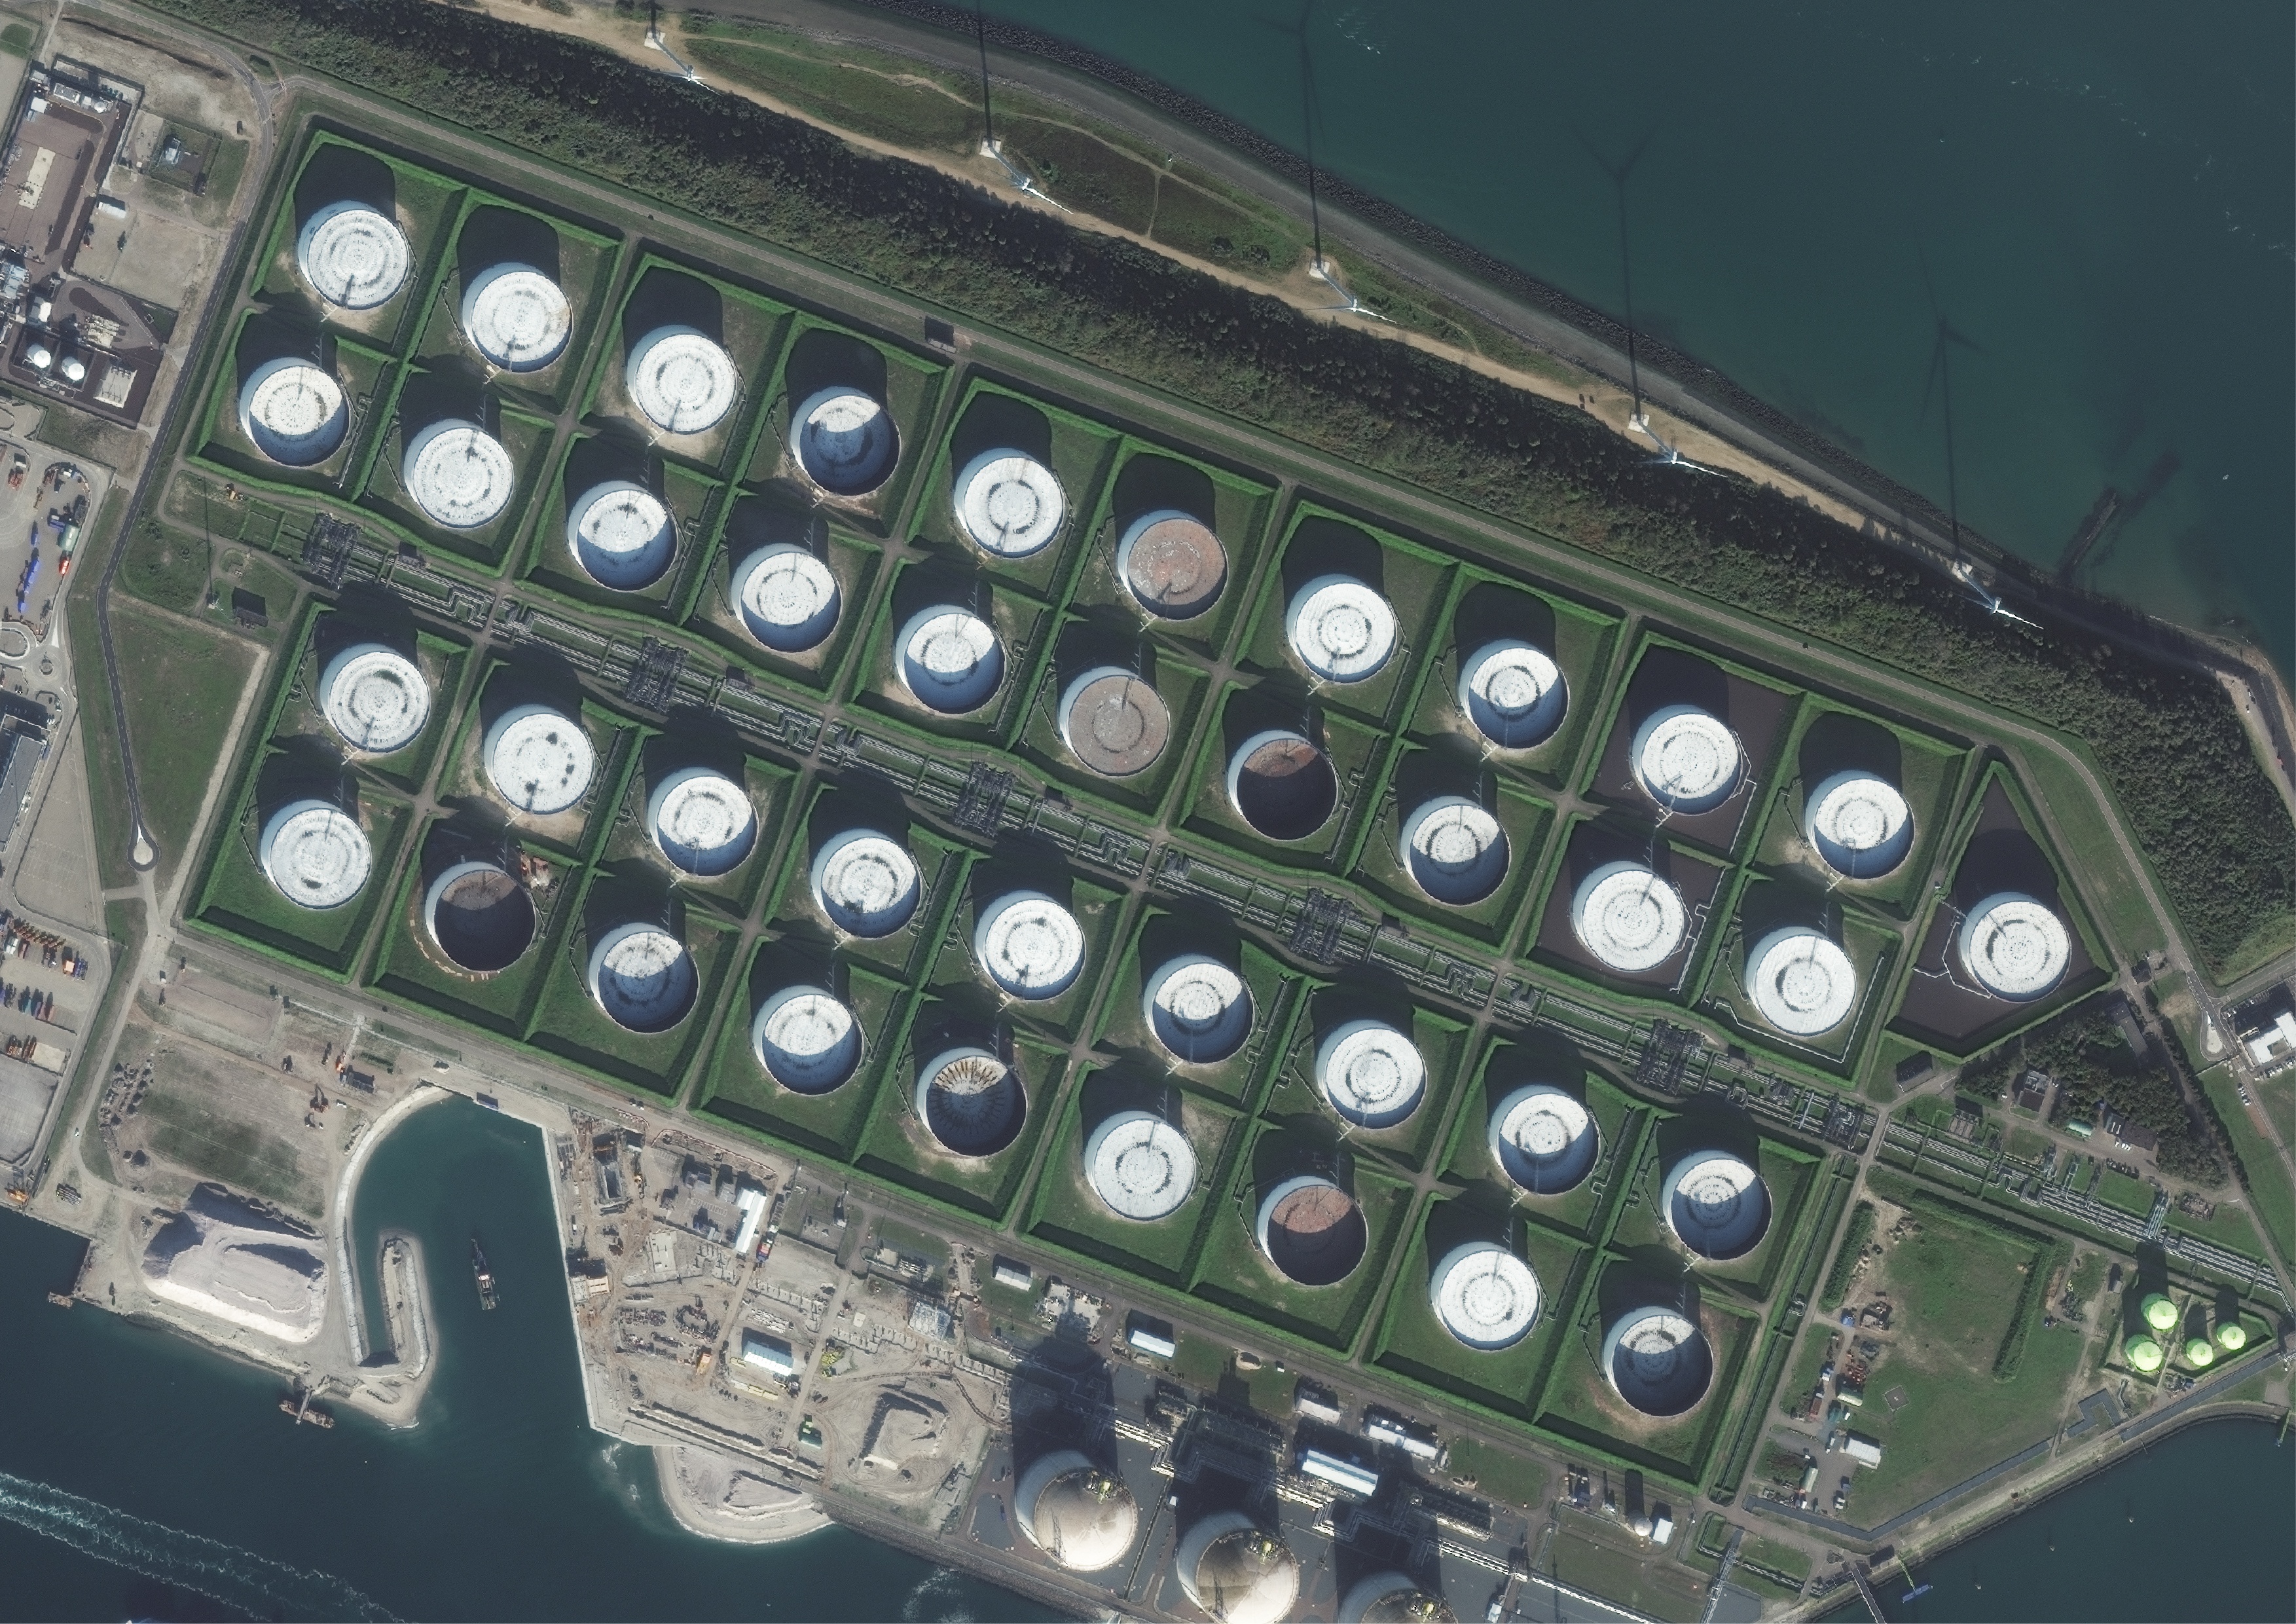
 Data © DigitalGlobe Inc
Let’s return to those three scenarios. Imagine any of them occurring. If you’re an energy trader, you’ll immediately start calculating the potential supply hit. But what if you could get reliable information about what was happening in real time in the exact location where an event was occurring?
That’s where satellite, drone-based and sensor imagery come in. High-resolution imaging can provide image capture that is accurate down to the centimetre. They can monitor individual tanks, an entire site or multiple sites. Augment that with images from drones and a more complete picture begins to be formed. The final ingredient: Big Data analytics.
You don’t even need breaking news to capitalise on this new form of alternative data. Simply being able to determine the exact storage capacities in a given part of the world and monitoring it over time can give you the last piece of the puzzle in order to work out a superior trading strategy.
Having such precise, reliable data is already a huge advantage for an energy trader. Now imagine being able to put that data in context.
Let’s say that a Category Four storm off the coast of Louisiana has done its damage and has finally dissipated. Thanks to satellite imagery, you have an accurate assessment of the current supply situation. The next thing you want to know is how long it typically takes to rebuild capacity after a storm of this level. This kind of location-specific scenario analysis, with pinpoint accuracy, in the past would have been a gargantuan task. Now it’s a matter of minutes.
It’s always reassuring to think that someone might be watching over you. For energy traders, that can be a reality.
To find out more about this kind of data solution, visit https://www.geospatial-insight.com/products/tankwatch/


